Search or browse all guides
Quick visual guide
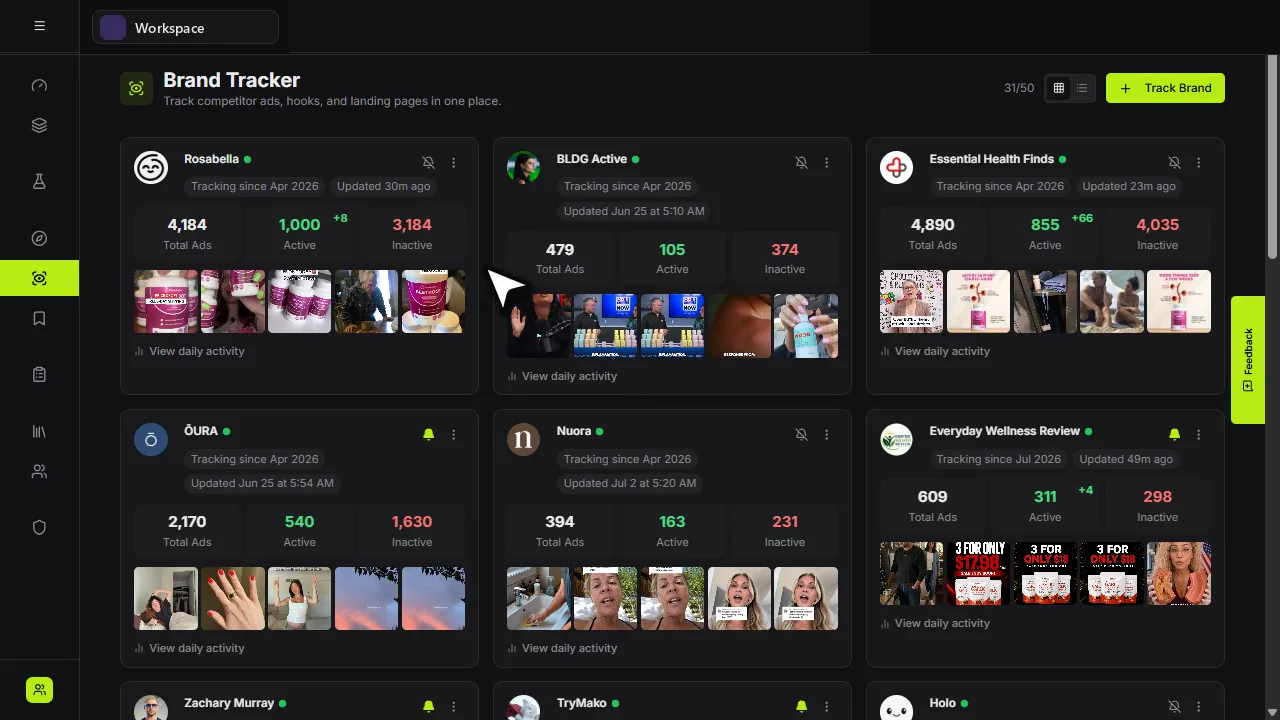
Track the brand once, then open its card for changes and daily activity.
- 1
Choose Track Brand
Open Brand Tracker and select Track Brand in the upper-right corner.
 Track Brand
 - 2
Open a tracked brand
Select a brand card to view its imported ads, hooks, and landing pages.
Open a card - 3
Review daily activity
Choose View daily activity on a card to see when active and inactive counts changed.
Daily activity
Red labels show the exact control to use.
Watch the full walkthrough
Detailed referenceOpen this for definitions, limits, examples, and troubleshooting.
Start monitoring a brand
- 1Open Brand TrackerSearch the shared directory by brand or advertiser name.
- 2Select the correct resultCheck identity and available activity before monitoring it.
- 3Choose a folderOrganize by client, niche, market, or research goal.
- 4Set alerts if usefulEnable new-ad alerts for the brand or its folder.
Use the tracked-brand page
- Review ad counts, longevity, formats, platforms, and other available breakdowns.
- The All, Active, and Inactive insight summaries load from bounded database aggregates, so large tracked libraries do not require the browser to download every landing-page or transcript row. If a summary request fails or exceeds its time limit, the panel shows Retry instead of disappearing.
- Brand cards abbreviate ad totals of 1,000 or more with the same compact format as the Brand Tracker sidebar, such as 1.3K. Hover or focus the brand name to see the month and year tracking began.
- Play hooks from a consistent control and open View all for the full list.
- Open any ad for normal click-to-play video controls, including video cards inside carousels. Insight totals and filtered landing-page summaries are aggregated in the database so large libraries do not need to download every matching row before the panel appears.
- Inspect the newest ads and save useful examples without leaving the page.
- Use notes to capture a private research conclusion for your workspace.
Review landing-page history
Different campaign URLs can legitimately produce identical screenshots while countdowns or offer text differ. Each URL keeps its own captured content and product analysis; matching another URL's screenshot alone does not make the capture invalid. Verification pages and artifacts from the wrong workspace or URL are still rejected. Recovery reuses the original saved desktop and mobile captures.
A provider retry becomes eligible at its scheduled time. Within each processing lane, it is ordered alongside first attempts by when the work became ready, so newer imports do not keep pushing an overdue retry to the back. Workspace fairness, user-request priority and capacity limits still apply; the scheduled time is not a guaranteed start time.
Product Match keeps each workspace's own product matches when it reuses an identical capture. Replaying an older capture does not roll back a newer observed product price or currency.
When workspaces track the same brand, its shared ad preview keeps the newest complete landing-page capture available to the linking job. Reusing the same capture in another workspace does not switch that preview back and forth, and an older retry does not replace a newer complete preview. Older captures remain available in Landing Pages history. Linking a capture to a large set of ads can continue in the background.
Open a tracked brand and choose Landing Pages to see the destinations used by its ads. Each sidebar row shows the number of matching ads and the combined running span from the oldest matching ad start date. The badge uses the same status dot and compact day count as an ad card. Hover it for the start and end details; when any matching ad remains active, End says Still running.
A normal brand refresh prepares a landing-page check only when that refresh stores at least one genuinely new ad using the URL. Multiple new ads that share one destination create only one check. Existing ads alone never trigger a periodic HTTP request. When a qualifying URL already has a fresh result, Tartol reuses it; otherwise it first compares a provider-free HTTP fingerprint and requests a new capture only when that fingerprint changed. After capture, deterministic content and screenshot hashes—and then one small text comparison only when needed—must confirm a meaningful change before product identity, page type, or product-image AI runs.
The same public URL has one global refresh lease, so simultaneous workspaces wait for and then reuse the completed capture instead of paying twice. Product-image review uses a free evidence-based shortlist of at most 12 candidates, one visual-ranking call with no omitted-candidate retry fan-out, and an immutable image-content cache. Exact duplicate ad inputs also reuse one completed analysis across ads and workspaces. A hard per-page budget permits at most six logical AI calls even on fallback paths.
When the capture comparison confirms a meaningful page change, Tartol writes a new timestamped desktop and mobile version and preserves every older version. Use the dated timeline above the screenshot to move between captures; the date in that timeline is the capture date. A failed or undecided comparison keeps the previous baseline so a later scan can retry instead of silently accepting the new page as unchanged.
The signed visual history and automatic recapture scheduler are read-only Brand Tracker UI behavior. Public REST and MCP continue to expose the underlying authorized ad and landing-page fields, but intentionally do not expose a separate forced landing-page recapture action or the signed historical screenshot gallery.
Refreshes and delays
If an import resumes from saved progress, ads already published from that observation keep their newer results and status. Repeated entries in a collected page are handled together. A later refresh preserves archived carousel media and transcripts when the underlying media file is unchanged, even if Meta rotates its temporary media access link; a different media file does not inherit those results.
Brand Tracker data is collected in the background. By default, refreshes run every 1 day for brands with up to 1,000 active ads, every 2 days for 1,001–2,500, every 3 days for 2,501–5,000, every 4 days for 5,001–9,999, and every 5 days for 10,000 or more. These intervals count scheduling cycles beginning at 04:00 UTC, rather than full 24-hour periods after completion. Finishing later in a cycle does not postpone the next eligible cycle; Next scan uses the same schedule. A successful complete scan satisfies its cycle, while retries continue to use the existing run protections. A Tartol super admin can edit, add, or remove any row in Super Admin > System > Brand Tracker > Brand Tracker Configuration > Schedule. There is no fixed row-count limit, the final remaining row also applies to larger brands, and saved changes apply to the next scheduler cycle.
Adding or refreshing a tracked brand gives its collection and ad processing user priority. Daily updates and orphan checks use the daily completion window; user requests start as soon as execution and provider capacity are available. The same priority applies through the website, public REST API, and MCP, with no client priority setting. A new run is queued without blocking the page. Queued runs are polled silently: cards, the sidebar, and brand details show no busy or status visual while waiting. Fetching appears only while the database run status is running. After fetching stops, safe reconciliation continues silently while the brand returns to its normal counts, thumbnails, and updated-time display. Import activity is verified from fresh server status; a saved browser snapshot cannot keep the importing badge active. While fetching, visible cards, expanded folders, brand details, and the sidebar refresh on a four-second polling cadence, with slower retries during network errors. Completed status clears old progress on the next successful refresh, without a manual reload. The public REST API and MCP tracked-brand views use the same server status and return null scrape_progress when no import is active; those clients refresh when their next read is requested. If a badge still appears stuck, check the current brand status before using Refresh ads; do not start another import solely because of an old badge.
The Brand Tracker landing page loads each card’s counts, recent-change badges, activity summary, and five newest thumbnail candidates together. A workspace-specific saved snapshot appears immediately while Tartol refreshes it in the background. If that refresh times out, Tartol keeps the saved cards visible and shows Retry instead of claiming that the workspace has zero tracked brands.
The in-house Meta collector durably checkpoints each cursor page and can resume an interrupted scan without waiting for a batch threshold. Newly committed ads appear in the brand library immediately while collection, media archival, and analysis continue independently. If pagination fails after making useful progress, Tartol keeps the ads already committed. Because that result is not a verified complete snapshot, Tartol never treats an unseen ad as paused and never creates pause events from it. Meta's initial library-size estimate is kept for scheduling. It does not become an exact requirement for a later response that omits its total: a trusted terminal response that explicitly reports no next page proves the snapshot complete. If that response supplies a total, Tartol still checks that all of those ads were collected. The initial embedded results follow the same completion rule: an omitted total is allowed only with explicit end-of-results evidence for the requested page and exact collected IDs. For embedded results, two stable reads must agree on explicit exhaustion and every admitted advertiser ID; a supplied summary total remains telemetry. Network pagination retains its lower-bound count check. Malformed or conflicting totals remain incomplete. REST and MCP use this collector automatically, with no client override for completion. Tartol Agent explains this behavior and the existing Refresh ads recovery action. After the final page, the collector retains control while validating completion so the browser cannot restart an older pagination sequence. When present, the estimate is also retained for the configured size-based cadence.
A partial tracked-brand scan does not advance the Last scan timestamp or satisfy adaptive cadence. Tartol pauses further automatic scans for that Meta page and sends one incident-aware operator alert instead of retrying indefinitely. A collection that finished but exhausts its bounded database-finalization retries opens the same circuit and preserves its staged snapshot. After the cause is reviewed, choose Refresh ads to acknowledge the incident; Tartol resumes the staged database reconciliation when possible instead of collecting the page again. A verified complete result clears the pause automatically, including when reconciliation reuses an existing scan-history row. Replaying a saved snapshot preserves its original Last scan timestamp and cannot clear a newer scan incident. Another incomplete result pauses and alerts again.
In-house collection
Meta’s displayed result total can differ from the ads returned by its public library. A small library can finish directly from the initial page when Meta explicitly confirms there is no next page and Tartol verifies the advertiser, query, every returned ad ID, and stable completion evidence. A differing summary count alone does not restart that completed collection. Without valid end-of-results evidence, the scan remains partial and cannot mark missing ads inactive.
Exact raw Meta checkpoint responses stay in R2. Postgres stores normalized ad fields plus compact R2 references, avoiding duplicate raw-response writes and reducing primary-database and WAL pressure during parallel scans.
Brand Tracker uses Tartol's in-house Meta collector exclusively. ScrapeCreators is retired from Brand Tracker: it is not a rollback provider, Brand Tracker workers do not load its keys, extension saves do not call it, and its balance cannot affect Brand Tracker health. ScrapeCreators remains available in Super Admin > API Keys > Key Pool & Rotation for Customer Profile Reddit research. Historical Brand Tracker provider names and usage rows remain only for audit and cost reporting. The in-house provider and configuration version are frozen when a run starts so configuration changes affect new runs only.
In Super Admin > System > Overview, the Daily window card shows the daily target and time left. Change window edits the daily scans and orphan checks target, which defaults to 12 hours from 04:00 UTC. Save window updates the current and future cycles. User actions and daily work run together when capacity allows; users receive extra slots first only under contention. Newly tracked brands without saved results get this user priority. Existing results are reused while refreshing in background. Local previews are read-only.
The Super Admin menu shows Command Center, Expenses, then System. System opens on Overview and groups Brand Tracker, Landing Pages, Ads & Video, Brand Scanner, Creative & Copy, and Cloud Resources. Overview opens with a short live status, a capacity verdict, Total capacity, Used, Available and Daily window cards, the Activity graph, and a compact Current work list. Current work shows active user queues, Brand tracker and Orphan checks with progress, status, elapsed time and an adaptive ETA. Expanded Brand Tracker stages each have their own ETA. Rates use the last five minutes of successful completions, widening to 15, 30 or 60 minutes for slow work and recent job runtimes for long individual jobs. The wider basis is labeled and refreshes every 30 seconds. Brand progress uses verified brands out of the complete cycle total; it does not mistake completed collection jobs for all planned brands. Separate queues keep their own estimates instead of promising a combined finish. Elapsed uses original recorded starts, including waits and retries, and daily work uses the cycle start. Unknown starts and finish estimates remain unavailable. While brand collection is unfinished, its conservative forecast of potentially new ads is not shown as a finish ETA; the overview waits for the actual processing workload. A next retry is labeled Retry, not a completion promise. Completed daily work stops its elapsed clock when the finish was recorded. Expand Brand Tracker stages only when more detail is needed. Future ads are forecasts and do not appear as running or queued work. Waiting for Meta or a website/provider retry does not mean more compute will help. A capacity warning requires actual ready work and a fresh allocation showing a shortfall. Stale or missing status stays unavailable. System alerts remains an expandable summary below Current work. Brand Tracker and Landing Pages tabs retain their workflow-specific activity and settings. Brand Scanner contains the former Scanned Brands page, with compact User brands, Guest brands, Deleted and All brands views. Search or filter by user and workspace, expand a brand to inspect its products, view workspace members or edit product details. Its header, navigation, filters and paginated table match the other workflow tabs. The old Scanned Brands menu link opens System > Brand Scanner. Scanner health and shared automatic capacity remain in Overview and Cloud Resources. Ads & Video shows activity and shared automatic capacity. Neither exposes old independent concurrency or polling controls. Creative & Copy links to settings and generated outputs. Legacy admin URLs open their matching System section. The Daily window card in System > Overview shows the cycle deadline and time left, or Window ended when overdue. Change window opens the daily scans and orphan checks setting, defaulting to 12 hours from 04:00 UTC. Save window updates the current and future cycles without resetting the start time. Creative Studio, Brands, Saved Ads and Media Library request prompt execution for user work. New tracked brands without saved results also receive ASAP priority; existing results are reused and refreshed in background. Brand Tracker > Schedule retains scan cadence and orphan enablement, without a second completion window. The shared planner recalculates admission every minute through a dedicated Google Cloud Scheduler service, independently of Brand Tracker draining and GitHub deployment runners. It also receives immediate wakeups when work arrives or advances. Failed or unfinished allocation requests retry automatically. System alerts flags missing capacity updates after three minutes; the alert clears after a fresh healthy check confirms recovery. The older controller retains its five-minute schedule tolerance during a rolling release. Daily Brand Tracker collection and orphan checks share the configured daily deadline. Ready media, transcription and analysis instead target a 120-minute queue budget per stage; older jobs increase urgency within the same regional limits and a shared database budget, which holds daily enrichment to a few slots while collected pages are still being published. The daily window is not permission to leave ready enrichment waiting until it ends. Saving an ad, tracking a new brand without saved results, scanning a brand, and Creative Studio or Copywriter generation receive user priority. Ready user jobs request execution immediately instead of being averaged over the daily window. User requests use separate queues where daily and interactive processing share a service; this priority follows retries and downstream steps. User and background work run concurrently when their requested allocations fit. Priority matters only when they compete for limited capacity: user requests receive additional slots first and background queues retain at least one slot. Running jobs are not cancelled. Cloud Run cold starts, running jobs, provider availability and regional quotas can still affect response time; immediate priority is not an instant-result guarantee. There is no fixed 2-4 job ceiling for the managed pipeline. The planner balances competing queues against configured regional CPU and RAM admission budgets, preserves provider failure brakes and deployment ceilings, and reserves headroom for supporting services. Browser collection and orphan jobs are included directly in the shared allocation. Before moving capacity to another system, the planner lowers admission and lets existing work finish; it does not cancel active jobs. Each queue retains one ready admission slot so new work starts between planner runs. Idle admission slots do not imply running instances: Cloud Run starts instances on demand. Demand uses measured timings when available and explicit initial estimates otherwise. Queues are never paused by the planner and unfinished work is not cancelled at the deadline. Missing workload or failure signals abort changes; decreases apply before increases, and only a fully successful apply is reported as applied. In-flight work drains normally. Concurrent jobs shows used / total and available admission slots from live Google Cloud Tasks dispatch statistics. Shared stages separate User requests and Daily work. Used counts requests dispatched without a reply, not jobs completed today. Available is the queue limit minus those in-flight requests, clamped to zero. Paused queues show Queue paused; stale or missing usage stays unavailable. Shared queue usage is repeated consistently across categories, never added together. Collection dispatch and the shared browser execution pool are separate limits. Local worker mode uses a separate read-only Google Cloud monitoring connection in the web app; worker dispatch continues to use fake credentials and loopback targets. Google Cloud capacity cards appear below System alerts on Overview and at the top of Cloud Resources. Total capacity, Used and Available each show CPU in vCPU and RAM in GiB. Choose All regions for combined values across the configured regions, or select a single region. Limits come from the effective Google Cloud Run quota, including approved regional overrides, not the planner budget. Used is consumed CPU and memory quota for the latest complete one-minute measurement, including production, staging, services and jobs in that project and region; it is not CPU utilization percentage or a count of servers. Google can publish usage up to four minutes late. Remaining capacity is the regional quota minus reported consumption, clamped to zero per region before combining regions. It is quota headroom, not reserved physical hardware, and one region cannot borrow another region's allowance. The cards show Unavailable if no fresh measurement exists. Partial regional coverage shows explicitly labeled reported minimums rather than hiding the regions with measurements. A returned zero remains zero; negative net consumption from released reservations is clamped to zero. These read-only cards refresh every minute using Service Usage and Monitoring read access. Cloud Resources also shows the automatic plan, regional planned/spare/reserved capacity, and separate live Google Cloud inventory and Monitoring samples across the configured Tartol regions. Inventory includes services, jobs and task queues, their per-instance CPU/RAM, concurrency, instance limits, observed instances and CPU/RAM utilization. Plan budgets and reserves are configured safety assumptions, not a live quota measurement or guaranteed free cloud capacity. Multi-region queue admission conservatively charges each eligible region. Staging and other services are outside the managed production queues and use reserved headroom; they are visible in inventory. Collector admissions are persisted and fenced with the same browser reservation lock used by orphan checks. Missing or stale measurements remain unavailable, not zero. A calculated, applying, failed or stale plan never claims a verified current allocation. Before the planner and schema are deployed, the UI says Awaiting planner activation. System monitoring is read-only and never starts a deployment or applies infrastructure changes. Saving a daily completion window from a card header, other workflow settings, and Brand Scanner product edits remain explicit Super Admin actions. System alerts appears below the work lists in Overview. It starts collapsed, showing current alerts and incidents resolved in the last seven days. Expand it to read current errors or Copy all for Codex. Repeat notifications count as one latest incident per check. Fresh healthy checks, recorded resolutions and matching external-monitor recovery messages automatically remove resolved incidents from the active list; a missing check or failed refresh is not proof of recovery. Counts are unavailable when current status cannot be verified. Localhost and staging read production checks through the signed-in Super Admin session; local notification configuration is not shown as a production failure. Recent production alert records remain readable before the full message archive is active. These records retain the latest incident per check, its resolution and delivery evidence, but cannot recreate an original message that was never stored. A delivery receipt confirms a notification channel, not necessarily Telegram. Copy one alert or Copy all for Codex includes its check name, timestamp, message, severity and diagnostic details, with credentials redacted. Current checks are live diagnostic evidence, not proof that Telegram delivered them. History archives platform health notifications, worker/provider alerts and external-monitor messages after their updated producers and database are deployed; old Telegram messages cannot be backfilled automatically. History records Telegram delivery when known; unknown must not be treated as sent. External-monitor alerts are retained in a storage outbox during site outages and retried using the same UUID without duplicate history entries. The panel reconciles up to 1,000 recent messages with production incidents or recoveries from the last seven days. Live checks also show ongoing failures regardless of when they first began. Old one-off job notifications are not treated as current platform failures without fresh evidence. If the source is incomplete it labels the counts and copy scope accordingly. Resolved errors stay out of the expanded active list and copied batch. Production collector deployments record an expiring monitoring window before deliberately pausing a previously running queue. Only that expected queue pause is deferred, only when the daily scheduler is otherwise healthy, and for at most 90 minutes. The window closes after success or failure. If a cancellation prevents cleanup it expires automatically; an unknown, failed, expired or unreadable window does not mute alerts. Existing pauses, real daily-run failures, unrelated checks and public outages remain alertable. Copying or viewing alerts does not run repairs, change production data or authorize deployment. Imported in Brand Tracker Activity is the total saved ad library, including inactive ads. Ad analysis counts ads with all required media, applicable transcripts, AI analysis and outstanding processing jobs resolved. Explicitly skipped steps count as resolved; pending, failed and missing counts stay distinct. Jobs finished only describes recorded jobs. Brand tracker completion also checks missing required ad details and saved outputs, using scheduled, collecting, processing, blocked and failed counts to keep unfinished brands in the cycle total. A confirmed empty scan has no detail work; retained media uses the same artifact checks as reconciliation. Missing required evidence remains unfinished. Collection counts brand-ad collection attempts, orphan status counts unique ads, and other stages count jobs. Empty stages say Nothing due; unknown counts never become completed. Orphan checks preserve daily history, status filters and retries, never treating an unknown response as proof of inactivity. A failed provider preserves checkpoints for recovery and cannot produce a completion promise. System telemetry, alert evidence and infrastructure allocation are private Super Admin operations. Public REST and MCP retain workspace-scoped results; Tartol Agent explains these screens without reading global operational data or changing infrastructure. The Activity graph in System > Overview sits below the Total capacity, Used, Available and Daily window cards. It defaults to today in your browser timezone and supports days from the last 31 days. CPU and RAM show five-minute average Cloud Run allocations by worker, including production, staging and supporting services; allocations are not CPU utilization. Hover, tap, or use Inspect time to see the workers and amounts at that time. Jobs completed shows recorded production completions by stage. The shaded daily window is a target, not proof that work finished. Historical attempts that were never recorded are not reconstructed. Missing cloud samples stay unreported, and unavailable or partial sources remain explicit. History refreshes once a minute using existing monitoring and saved job records. Current work shows actual unfinished user queues, Brand tracker and Orphan checks, including pending retries and unavailable status. Finished daily Brand tracker and Orphan checks move to Completed today with their progress and elapsed time. Completed today also includes Creative Studio image/editor jobs, Copywriter jobs, Brand Scanner website/product scans and Media Library video jobs that finished since midnight in the browser timezone. These job rows show the average recorded elapsed time per completed job, including retries, only when every completion has timing. The list reuses saved Activity history, refreshes once a minute and stays on today when the graph day changes. Missing or partial history stays explicitly unavailable. Brand tracker means tracking competitor ads; Brand Scanner means scanning a website for a user-added brand and its products. The Brand Tracker stages breakdown moves with the Brand tracker row and is collapsed by default. When no work remains, Current work says No current work. Idle queues do not appear as completed jobs. Brand progress counts verified brands out of the whole cycle. Every Current work row and expanded Brand Tracker stage shows an ETA and approximate finish time. ETA starts with successful completions during the rolling last five minutes and refreshes every 30 seconds. Slow stages widen to 15, 30 or 60 minutes when the shorter window has no completions; longer jobs can use the median of up to ten recent completed job durations from the last 24 hours and current parallel jobs. The row labels a wider window or Recent runs when used. Parallelism is already included in measured completion speed. Brand tracker uses fully verified brand completions and cannot finish before its slowest remaining stage. After collection finishes, measured remaining stage queues replace old full-brand runtimes that may contain resolved outages. Stages use their own job counts. Finish estimates require fresh evidence; provider interruptions do not produce a promised finish. New work or changing capacity can change the ETA, and a new workload with no usable history stays Measuring. Retry times are labeled separately. Daily elapsed time starts at the cycle start and includes waits; job elapsed uses its original recorded start rather than a short throughput sample. In the Daily window card, Change window edits the target of 1–24 hours in 15-minute steps. The default is 12 hours from 04:00 UTC. Save window updates the current and future daily cycles without resetting the clock. Local and staging previews are read-only; use the production System Overview to save. Capacity recalculates every minute and when work arrives. User requests and background work run concurrently when their allocations fit; users receive additional slots first only when demand competes for limited capacity. Existing jobs are not cancelled. New brands without saved results receive user priority through collection and enrichment; saved results are reused while refreshing in background. More workers do not resolve a website or provider wait. A capacity warning requires actual ready jobs and a fresh allocation shortfall; forecasts for ads not yet collected cannot create that warning. Cloud cards use the selected regions and latest Google readings, which can lag by four minutes. An idle region retains zero only when explicit quota and instance history and job activity agree; absent data is never zero. Partial totals name missing regions and show a greater-than-or-equal sign. Cloud Resources retains the detailed Usage by region report. Daily history, global capacity and the completion target remain private Super Admin information. Public REST and MCP intentionally cannot expose this cross-workspace telemetry or change infrastructure. Tartol Agent explains the screen and its limits using this shared guidance without accessing global operational data or adding action tools.
In System > Overview, Current work uses actual jobs. Forecasts for ads not collected yet cannot turn a finished stage into a full queue. Brand tracker still shows the full planned brand count, so a scheduled brand remains unfinished even when recorded collection jobs are done. Waiting for capacity means ready jobs need more admission slots to meet their target under the current allocation; it does not mean the whole Google Cloud project has exhausted its quota. Running means a job is currently processing, even if other jobs have scheduled retries. Waiting for Meta means the source has not supplied a verified answer. The next retry time is shown when recorded. More workers cannot make a missing provider response appear. Saved ad-detail recovery reuses the collected snapshot and confirmed answers; detail checks do not count as ads needing another media, transcript, analysis or landing-page job. One unresolved ad can be revisited after the other saved ads have been checked. When the exact Meta ad page explicitly says the ad is not in the Ad Library, an orphan check marks it inactive and completes. Confirmed inactive ads leave the daily orphan queue and are not checked again while inactive; when Meta omits the end date, the recorded date is when inactivity was confirmed. The interface shows Inactive and the date without an additional qualifier. Missing controls, loading screens, blocking and timeouts remain unfinished work. Global queue and retry diagnostics stay private to Super Admin; the public REST API and MCP expose only authorized workspace results, and Tartol Agent explains these statuses without controlling infrastructure.
In Super Admin > System > Brand Tracker > Activity > Brand status, Unavailable in Ad processing means the processing report could not be read; it does not mean the saved analyses disappeared or every ad failed. The report checks required media, transcripts, AI analysis and unresolved processing jobs across the full saved library, including inactive ads. Incomplete means required results are missing, not that a job is necessarily queued. Old unresolved media or screenshot work can remain after the daily Brand tracker cycle in Completed today has finished. Failed counts and Attention exclude historical attempts when the affected step now has a verified completed or explicitly skipped result, even without a newer successful job row. Landing-page recovery needs the attached complete capture and intelligence for the correct URL and workspace after the failed attempt; an older capture or an unlinked cached result is insufficient. Active retries, incomplete outputs, and unresolved failures remain visible regardless of age. Historical attempts remain available for diagnosis; reading status never deletes them, starts another scan, or spends provider credits. Healthy describes collection status; Ad processing reports downstream processing. Brand counts load in small batches capped by both library size and brand count. A timed-out group can retry once in smaller groups within a bounded recovery window, using the same two readers. Successful counts stay visible, and persistent failures remain unavailable. A timeout or missing database update is explained above the table; Refresh retries the report without restarting scans or charging for another analysis. Unknown counts are never shown as zero or complete. These global counts remain private to Super Admin. Public REST and MCP expose authorized workspace results, and Tartol Agent provides guidance without accessing global counts or controlling jobs.
If Automatic capacity says Update overdue, check System alerts for the last allocation timestamp. Capacity recalculates every minute on its own scheduler and retries unfinished updates. A gap of three minutes is flagged; recovery clears the active alert after the next healthy check. Brand collection can continue while allocation is checked, and an allocation retry does not restart or discard user work.
Landing-page capture uses an in-house browser. Each capture has a 100 MB proxy byte budget to limit traffic through the paid proxy; it is a ceiling, not a target to consume. Reaching the budget stops excess downloads while preserving the rendered page and saved screenshots; readable-content and image checks still apply. Public GET page-data requests and public assets use bounded direct downloads without browser cookies or authorization, with a small proxy fallback for session-bound resources. Repeated requests reuse capture-local results, public assets can reuse cache, and independent product and page classification checks run together. The speed target for a healthy landing-page workflow is under one minute, not a hard cutoff or a guarantee for blocked sites or unavailable providers. Duration remains the full elapsed workflow time, including queues and retries. Do not repeatedly submit a slow page: unfinished jobs preserve checkpoints and resume automatically.
A landing-page job includes saved screenshots and later AI content and product checks. An AI request error can leave the workflow unfinished after both screenshots were captured. Request validation errors are distinct from exhausted credits: adding funds does not repair an invalid request. Captured page text keeps complete Unicode characters when shortened for AI, and rejected comparisons never count as proof that a page is unchanged. Recovery reuses the original capture and completed AI checkpoints. Follow the existing job rather than importing another copy. The daily collection completion window remains configurable; ready media, transcription, and analysis queues target a 120-minute budget per stage, with older ready jobs increasing urgency. This scheduling target uses existing regional resource budgets and a shared database budget that holds daily enrichment to a few slots while collected pages are still being published, preserves user priority and provider limits, and is not a completion guarantee during an outage or capacity shortage. A low enrichment percentage can mean queued work rather than failed ads; inspect the pending, failed, and never-started counts. Global queue diagnostics and recovery controls remain internal-only: public REST and MCP expose workspace-scoped results, and Tartol Agent provides guidance without infrastructure actions.
An old Brand Tracker run can still own a scan while recent saved progress or a bounded scheduled retry proves it is recovering. Completed history does not hide an active retry from monitoring. Abandoned work and overdue daily runs still alert. Daily-run age is reported separately from the last recorded update; a long run does not mean no ads have finished. Detail recovery skips already verified ads in bounded reads and preserves every unconfirmed answer for another attempt. Ordinary ad-processing provider waits stay visible while the external monitor gives the same incident 15 consecutive minute checks to recover before paging. The original interruption is saved independently of the current retry error, so retrying does not reset that incident even before its first notification; operator-review cases keep immediate alert eligibility. Landing pages that redirect while switching to the mobile layout can recover inside the same browser and capture deadline, preserving the desktop screenshot. Repeated navigation, unreadable pages, and access failures remain unfinished and cannot produce a false completed capture. These are internal monitoring rules, not public REST or MCP actions. Tartol Agent can explain them without accessing global diagnostics or changing infrastructure.
Daily work can borrow one unused user-request slot per processing stage while no user work needs it. When user work arrives, it gets the next available slot; running jobs finish normally. This uses the existing cloud limits. Other user-job queues have a protected minimum of 20% of regional CPU and memory, separate from the operational reserve. In the current central-region fleet their dedicated slots reserve 30% of CPU and 22.5% of memory for Creative Studio, Copywriter, video processing, Brand Scanner and user Brand Tracker dispatch; background borrowing cannot take those slots. Ready collections use their admitted browser slots immediately rather than stretching work across the daily window. A worker returning to the retry queue retains its recent heartbeat and saved progress for monitoring; abandoned queues still alert. Meta detail recovery selects the requested ad inside the foreground popup when the same ad also appears behind it. Enrichment delays can come from queueing even when each ad processes quickly; external failures and larger bursts can still extend completion times.
Temporary database failures keep the original creative, copy, and brand-scan job unfinished; an unreadable subscription record is not proof that a subscription expired. Completed work must be saved before a worker acknowledges completion. Creative, copy and editor outputs are saved together with their completion checkpoint, so a retry after a lost reply reuses the saved slot. System pickup warnings account for recent collection progress and dispatch without resetting the total run duration. Recovery checks recent saved progress before reclaiming an old job, and scheduled provider waits are not worker stalls. Accepted AssemblyAI transcript requests retain their provider receipt and resume polling the original request. If submission acceptance cannot be confirmed, the job waits for review instead of buying another transcript. Audio classification failures remain unfinished instead of producing guessed results. Missing product descriptions do not crash a website scan. Automatic capacity updates retry brief Google queue-read failures within the same deadline and exclude brand scans whose provider retry is not due. Historical Expenses refreshes reconcile one day at a time and resume after a failure; today and yesterday keep their existing minute refresh. Scheduled SEO jobs retain article and hero results across storage failures; an uncertain paid request waits for reconciliation instead of being purchased again. Generated drafts remain unpublished until the blog is published. Private provider receipts, leases, global alerts and expense-refresh administration are not public REST or MCP actions. Tartol Agent explains recovery without exposing those records or changing infrastructure.
Brand Tracker Configuration opens on Activity, followed by Schedule and Proxy pool. Activity separates Brand status, Orphan status, and Scan history. Brand status shows every tracked page with healthy, failed, not-started, or live scan state, Active ads, Ad processing, last scan, and next scheduled scan. The table starts with the most active ads first and supports sorting by column. Brand pictures appear to the left of the name and workspace count, with initials when a picture is unavailable. Active ads shows currently active ads. Imported shows the total ads saved for the brand, including inactive ads. Current ad processing shows how many active ads and inactive ads with live processing work have finished all required processing: media, transcripts when applicable, AI analysis, and outstanding processing jobs such as landing-page capture. Explicitly skipped or inapplicable steps count as resolved. Incomplete and failed counts appear below. Incomplete means required results are missing, not that a job is necessarily queued. Historical inactive-ad failures are excluded from current status and remain in the saved library and job history. An inactive ad with production work queued or running remains included. Age alone never hides an unresolved active ad. Completed today in Overview covers the daily cycle. Healthy describes the current collection status. Continuing saved Meta detail checks is progress, not a failed scan. The visible status table refreshes every 30 seconds; only a currently failed scan shows a red scan error. Recovered historical step errors leave the failed count and Attention automatically; unfinished steps and active retries stay visible. These are ad-processing counts, not proof that every brand collection detail was fetched. Missing processing counts show Unavailable rather than falling back to AI-only counts. Scheduling uses the active-ad count, not the full historical library. A partial tracked-brand snapshot keeps the last verified complete scan time, moves the page to Attention, pauses automatic cadence, and raises one Telegram operations incident; Refresh ads explicitly resumes that page. Color-coded count pills make attention, scanning, healthy, not-started, and inactive groups easy to spot. A page with no active tracker in a workspace with a usable subscription shows Inactive and No active subscription instead of Healthy and Due now. Its scan history remains available, and Current ad processing shows Not scheduled until an eligible subscription and active tracker exist. This remains a Super Admin diagnostic; public REST and MCP do not expose account-wide tracker status. The table starts with the largest imported libraries first, and every column heading can sort it. System > Overview shows a live status, a capacity verdict, Total capacity, Used, Available and Daily window cards, an Activity graph, and a compact Current work list. Current work shows unfinished user jobs, Brand tracker and Orphan checks, with progress, status, elapsed time and estimated finish. Finished daily Brand tracker and Orphan checks move to Completed today with their elapsed time. Creative Studio, Copywriter, Brand Scanner website/product scans and Media Library video jobs completed since local midnight also appear, with average elapsed time per completed job when all timings are recorded. Brand tracker refers to competitor-ad tracking; Brand Scanner refers to website/product scanning. Completed today stays on the current day when the Activity graph date changes; pending retries and unavailable status stay in Current work. If nothing remains, Current work says No current work. Expand Brand Tracker stages for a short breakdown beside the Brand tracker row in its current or completed section. Completed collection jobs do not hide brands still waiting to start: brand progress counts verified brands out of the whole cycle. Forecasted ads never count as current queued work. Elapsed includes recorded waiting and retries; unknown timings remain unavailable. Every Current work row and expanded Brand Tracker stage shows an ETA from recent completions. The default five-minute window widens to 15, 30 or 60 minutes for slower work, with recent job durations available for long-running jobs. Brand tracker uses full verified brand completions and the slowest remaining stage; after collection, it uses the measured remaining queues. The smaller stages use their own successful jobs. The row labels longer windows or Recent runs. ETA refreshes every 30 seconds; missing history stays Measuring and unresolved provider waits keep a retry time rather than a finish promise. Retry times are clearly separate from finish estimates. Provider waits do not imply a compute shortage. A capacity warning needs actual ready jobs and a current allocation shortfall. User and background work run together when capacity allows; user requests get additional slots first only when capacity is tight. Running work is not cancelled. The cloud cards use selected regional Cloud Run limits and reported CPU and RAM usage, including production and staging. Google readings can lag by four minutes. Partial readings name the missing regions instead of treating them as zero, and regional limits cannot be transferred between regions. Cloud Resources separates calculated allocation from observed utilization. Brand Scanner replaces the former Scanned Brands menu page and the old scanner panel. It uses the same compact header, view tabs, filters and paginated table as the other workflow tabs. User brands, Guest brands, Deleted and All brands views support search and user/workspace filters. Expand a brand to inspect its products, open workspace members or edit product details. Brand logos and product thumbnails reuse saved images. Temporary loading failures retry automatically; an unavailable logo shows the brand initial, and an unavailable product image shows a product-box icon. Refresh reloads the list without starting a new scan. Existing Scanned Brands links open System > Brand Scanner. Scanner health and shared automatic capacity remain in Overview and Cloud Resources; the old independent concurrency controls stay removed. Cross-workspace scanner records and product edits remain Super Admin only; public REST/MCP retain workspace-scoped access and Tartol Agent provides guidance only. System alerts appears below the work lists in Overview as an expandable summary with current and resolved counts. Expand it to see active errors, Copy all for Codex or copy one error. Recovered errors automatically leave the active list and copied batch, using fresh healthy checks, recorded resolutions or external-monitor recovery messages. Repeated notifications count once per check. Resolved counts cover the last seven days. Production collector deployments use a bounded monitoring window for their deliberate queue pause; unrelated failures and public outages remain alertable. These production diagnostics are also visible on localhost and staging. Before full message archiving is active, the page shows existing incident records with resolution and delivery evidence; original messages that were not stored remain unavailable. Automatic allocation requires its database and producer updates; unavailable data is labeled explicitly. Schedule keeps Refresh by brand size, orphan enablement, and Plan limits. Set the daily completion window using Change window in the Daily window card in System > Overview; Save window updates the current and future cycles without restarting the clock. Scan history keeps brand scans and orphan checks separate.
When Orphan Ad Checking is enabled, active Meta ads saved without an active Brand Tracker or catalog subscription are checked individually once per daily cycle starting at 04:00 UTC, regardless of brand-size tiers or weekly brand cadence. The same ad saved multiple times or in several workspaces has one lookup. The check requests that exact ad, never the whole advertiser page, and does not import new ads, download creatives, regenerate transcripts or run analysis. An explicit active result refreshes its confirmation time without resetting the original start date. Explicit inactivity freezes the running date using the returned end date; if Meta omits it, the date the ad was confirmed inactive is recorded. A missing response, timeout or ambiguous result preserves the previous status and schedules a delayed retry of the original unfinished check. Completed checks are retained when a batch resumes. An unconfirmed individual ad stays pending while the same browser continues unrelated checks; a provider or session interruption pauses the batch. In Activity > Orphan status, Confirmed / planned counts unique ads; Active + Inactive equals confirmed. Pending lookups, skipped ads and expired checks are separate. Complete means all planned ads were confirmed; Finished with skips means some ads left scope or checking was disabled. Earlier page-scan history is labelled Legacy page scans: ads checked meant all active ads returned by the page, while completed counted pages. Public REST and MCP expose the resulting ad status through existing authorized workspace reads; they intentionally do not expose global orphan scheduling or cross-workspace maintenance queues. Tartol Agent provides guidance only.
When the exact Meta ad page explicitly says the ad is not in the Ad Library, Tartol marks that saved ad inactive and completes its orphan check. Confirmed inactive ads leave the daily orphan queue and are not checked again while inactive. When Meta supplies no end date, Tartol uses the date the ad was confirmed inactive. The interface shows Inactive and the date without an additional qualifier. A blank page, timeout, blocked request or conflicting status is not a removal verdict and keeps the prior status until verification succeeds. Existing missing-ad retries receive a fresh check before their status changes. The resulting inactive status appears through the existing workspace-scoped browser, REST and MCP reads; private check evidence and global scheduling remain Super Admin operations. Tartol Agent explains the same distinction without changing ad statuses.
Super Admin > System > Overview contains Completion window in the Brand Tracker card header. It defaults to 12 hours and accepts 1–24 hours in 15-minute increments. The target covers daily scans and orphan checks starting at 04:00 UTC, including collection, ad details, media, transcripts, analysis and required landing-page work. Brand refresh intervals still follow the configured size tiers or fixed cadence in Brand Tracker > Schedule. Save window updates the current and future cycles without resetting their start time. Creative Studio, Brands, Saved Ads, Media Library and newly tracked brands without saved results receive ASAP priority for waiting users. The planner averages duration divided by ad count across the last 10 completed measurements for each workflow stage, adds a 25% time allowance, and adjusts parallel work as the deadline approaches. It uses initial estimates while learning, includes an estimate for enrichment of uncollected ads, and shows actual jobs separately from future workload estimates, with parallel slots constrained by the shared regional resource budget. The stages overlap as ads arrive; the planner reserves downstream time instead of dividing the whole window into serial stage budgets. Full workflows complete only after all required artifacts and jobs finish; collection alone is insufficient. Provider interruptions remain pending. Completion target at risk means available provider or infrastructure capacity, an interrupted workflow, or the remaining time prevents a reliable completion estimate. A single large brand can also have serial collection work. This is a target, not a guaranteed deadline or automatic cloud-quota increase. Global scheduling controls and cross-workspace capacity telemetry are intentionally available only to Super Admin, not the public REST API or MCP. Tartol Agent explains the settings and statuses without changing infrastructure.
A scan can finish collecting ads while media, transcripts, analysis or landing-page jobs are still processing. Saving the scan result registers those ads for separate background completion checks; unfinished enrichment does not make the collected scan fail. Completion reporting checks up to 1,000 ads per pass and uses each ad's own processing history. A failed finalization may still have an intact saved snapshot. After the underlying issue is repaired, authorized recovery can finish that same run without another Meta or proxy collection. Its original collection time is preserved and recovery does not send duplicate new-ad alerts. Ad details have not completed means required detail evidence is still missing even if downstream jobs finished. Recovery reuses the saved collection and confirmed details, requests only missing eligible ads by exact ID, and checkpoints each answer before continuing. Provider interruptions retain the same generation and delay its retry. A verified text-only source needs no media upload; absent metadata alone never proves that an ad is text-only. Partial snapshots and missing required outputs remain incomplete. Global finalization recovery and capacity reporting are internal-only: public REST and MCP retain their existing authorized workspace status and refresh operations, and Tartol Agent explains the states without running cross-workspace repairs.
Production collection requires confirmed collection authorization, a separate explicit Production replacement approved confirmation after representative probe testing, and at least one active reusable proxy-pool gateway. Direct Google Cloud egress is limited to an explicit local/staging probe, stops after 100 collected ads, and cannot be used for production collection. Tartol atomically reserves the run, reusable proxy session, and a slot within the current System browser allocation shared by production and staging before asking Cloud Run to start. A newly queued brand immediately attempts admission, and the minute drain retries queued work and fills unused slots. A proxy is returned to the pool as soon as collection finishes; excess scans wait durably in the queue instead of failing when the worker allocation is fully occupied. Every dispatching reservation remains visually queued; Fetching begins only after the database run status becomes running. If a launch is rejected or its reservation expires before browser startup, Tartol returns it to the queue without advancing the cursor or generation or consuming a collector runtime-failure retry.
The in-house collector durably checkpoints every collected page before continuing. Ads saved by an interrupted or partial run are retained for parity review, but only a verified complete snapshot may reconcile missing ads as inactive. A timeout, block, incomplete cursor stream, or other partial result never pauses an unseen ad or creates a false pause event. Large scans preserve the active generation and opaque Meta cursor, rotate the browser before a long pagination session degrades, prefer a different reusable proxy slot, and continue from the durable cursor after a bounded delay. An ambiguous Meta HTTP 200 response preserves that cursor for a bounded retry on another proxy; only a definitive cursor-invalid response starts an isolated generation from the beginning. Only the generation that proves exact exhaustion can reconcile missing ads. After collection, large groups of confirmed inactive ads are committed in page-indexed, bounded database-only batches. If that reconciliation is interrupted and its checkpoints remain intact, Tartol reopens the same staged run and finishes it without another Meta or proxy collection; after bounded retries are exhausted, automatic cadence pauses and Telegram alerts an operator instead of silently collecting the page again. The Brand status changes from Failed to the recovered final result after completion. Raw R2 checkpoints are retained for 30 days, and database collection-staging rows are pruned after 3 days.
For a production in-house run, every committed checkpoint writes only compact staging rows and coalesces a durable publication cursor. A single bounded materializer publishes those staged pages shortly afterward and creates the first required processing step for every imported ad. This keeps collector checkpoints and heartbeats fast during database pressure, prevents thousands of concurrent scans from publishing at once, and lets excess work wait safely instead of holding locks or failing. Final reconciliation cannot start until every staged page for that generation has been published. The bounded fair dispatcher then controls how many processing jobs start at once. The page name and photo are saved from the first available batch before publishing its ads; the photo is archived to durable storage without waiting for the full import. If Meta has not returned a usable photo or the download fails, the initials remain as a fallback and later publication retries. Accepted imports immediately show Starting import while waiting for a collector; Fetching appears once collection starts. A daily refresh of a brand that was already imported runs quietly in the background; its card keeps showing when it was last updated. The first available batch prompts publication immediately, and later checkpoints prompt it about every 10 seconds per run, subject to available capacity. The visible Ad Library checks for published ads about every 10 seconds throughout import and refreshes once more at completion, even if the summary count is unchanged. Hidden tabs pause polling and resume when visible. Ads imported counts published ads only, so collected checkpoints waiting for publication are not presented as browsable ads. Post-collection reconciliation continues silently when ads are available; an empty library shows Finishing import until completion. Provider startup, throttling, and publication load can delay the first ads; Starting import acknowledges the request immediately without promising that ads already exist. User-visible Total, Active, and Inactive are imported-row counts, remain internally consistent, and never display a negative inactive value; Meta's separately retained library-size estimate is used only for adaptive refresh cadence. Cards use the provider source URL until background archival finishes. Original creative media is queued separately and streamed by the Cloudflare media-ingest Worker directly into R2 without using the residential proxy or Google Cloud-to-R2 transfer. Progressive publication never marks an unseen ad inactive. It can confirm a returned ad is active, but only the final verified complete snapshot may reconcile missing ads.
Imported ads move through media upload, video transcription when needed, and creative analysis independently of collection. Meta video archival supports files up to 256 MiB. If the preferred HD video exceeds that limit, Tartol tries a provider-supplied lower-resolution version of the same creative. It preserves available source variants and can recover older variants from the original verified collection checkpoint without scanning Meta again. The stored video and its thumbnail refer to the rendition that actually succeeded. If every supplied version exceeds the limit, the media remains explicitly failed and that job does not repeat the same size rejection. Temporary storage interruptions keep the original job waiting for recovery. Videos above the normal 150 MiB in-memory processing threshold stream into a bounded temporary file for poster and storyboard generation; audio extraction streams independently. A media upload failure retains its specific cause in the processing history. If a later Meta response omits carousel URLs, Tartol still queues the image or video sources retained on the ad; the carousel stays incomplete until those files are archived. Non-video ads with copy and no available media source still proceed to text analysis; ads with no analyzable content receive an explicit skipped result. When the analysis provider is busy, work returns to the queue with a delayed retry and keeps its failure-attempt allowance. The ad stays pending instead of becoming failed just because another request holds the provider slot. If the subscription check temporarily fails, processing stays queued for another check; only a confirmed inactive subscription can skip the job. Temporary database or network errors during processing also return the job to a delayed retry without using its failure-attempt allowance. A saved analysis result remains reusable if only writing the ad update failed. An expired analysis job cancels its provider work, and a genuine timeout records the current reason instead of preserving an older billing error. A bounded set-based safety repair recreates the earliest missing step for any eligible ad, so processing coverage does not depend on the scan reaching final reconciliation. In an ad's Creative Targeting section, Queued means this background pipeline is still waiting or working regardless of the ad's age; only an explicit failed state is unavailable. Super Admin > Command Center > System (formerly System Health) follows Users within Command Center. Queues summarizes processing-step completions, not complete ads. Its ETA uses the latest continuous activity window and suppresses incomplete estimates. SEO is excluded. Video uploads converts uploaded videos and makes thumbnails. It shows one expanded card per row for Brand Tracker, Creative Studio, Brands, Saved Ads, and Media Library. Brand Tracker and Saved Ads show their own ad files, transcripts, ad analysis, and landing pages; Creative Studio separates Image Ads, Copywriter, and Editor. Video uploads means converting uploaded Media Library videos and making thumbnails, not imported-ad analysis. Running counts real worker claims, while unclaimed dispatches remain waiting. Done 24h counts successful jobs for each step during the past 24 hours, not fully finished ads or a batch completion percentage. Left counts that step's queued and running jobs; + next separately shows predictable work that will follow earlier steps. ETA covers the current queue only, using the latest continuous processing activity up to 15 minutes and current concurrency. Idle gaps reset the activity window. A recent resume says Measuring until at least three jobs finish and one minute of activity is observed; provider waits, incomplete timing samples, delayed progress, or unavailable attempt timing suppress the estimate. Brand collection, imports, and website scans show Unavailable for ETA when their persisted run timestamps cannot prove current-attempt speed. Data older than 90 seconds becomes unavailable and its counts and ETA are hidden. Problems stay beside the affected feature, shared service problems appear above the workloads, and feature links jump to expanded sections. Retired SEO work is removed. Refresh checks status without starting a repair or sending a test alert. This cross-workspace view is super-admin-only and intentionally excluded from public REST, public MCP, and Tartol Agent actions; Tartol Agent can explain how to read it. Enrichment-rate health measures only ads that are 2–24 hours old, giving the production-safe queue time to finish a normal daily burst; an alert now separates never-started, pending or incomplete, and failed ads. A paused Brand Tracker queue remains visibly degraded, but notification waits for 20 consecutive external probes so a brief intentional mixed-version rollout pause does not page; a stranded pause still does. These platform-wide operational diagnostics are internal-only and are intentionally not exposed by the public REST API or MCP.
The Command Center Overview calendar defaults to All time; selecting another range scopes its business, growth, acquisition, operations, and activity data together. The Command Center loads its Ad processor queue, pipeline, failure, and subscription-eligible analysis counters from one authenticated database snapshot, so a refresh does not fan out into page-by-page count requests as the number of tracked brands grows. Raw completed, failed, canceled, pending, queued, processing, and retry-scheduled Ad processor attempts are retained indefinitely. Automatic queue-history deletion is intentionally disabled; any future archive or retention policy requires a separate explicitly approved migration. The aggregate surface is service-only and intentionally unavailable through the public REST API and MCP.
Super Admin > Command Center > Database is the internal database diagnostic view. It charts recent connection use, query and transaction duration, and Brand Tracker/ad-processing queue pressure; lists current blockers, sanitized slow-query fingerprints, and the largest tables; and turns sustained evidence into specific recommendations. Connection and latency signals count application client sessions only: long-lived Supabase system and Realtime replication backends are excluded, and idle transactions must persist for two seconds before appearing. Copy an AI-ready diagnosis copies the sampled metrics and recommended investigation without secrets. The capacity card is a conservative workload-based estimate with a confidence label and range, not a load-test guarantee. The Supabase upgrade signal requires sustained pressure rather than one spike, and storage guidance becomes exact only when SUPABASE_DATABASE_STORAGE_LIMIT_GB is configured. PostgreSQL statistics do not expose Supabase host CPU or RAM, so the page directs a super admin to Supabase for those charts instead of inventing values. Samples are minute-bucketed, lightweight, retained for 30 days, and identical dashboard requests are coalesced. A stuck or repeatedly failing publication queue alerts through the existing Telegram health pipeline after three consecutive unhealthy probes. This cross-workspace view is restricted to the Tartol super admin and intentionally unavailable through public REST, MCP, and Tartol Agent actions; Tartol Agent can explain where it is and how to interpret it.
Super Admin > Expenses shows tracked provider spend for the latest 7, 30, or 90 UTC calendar days and compares it with the immediately preceding window. Use Model, Provider, and Feature to regroup the daily chart; the tables also break spend down by operation. Raw provider usage remains the source of truth, while an internal daily rollup refreshes today and yesterday every ten minutes so the dashboard stays responsive as the ledger grows and reconciles late completions. This platform-wide financial view is restricted to super admins and intentionally unavailable through the public REST API and MCP actions. Tartol Agent can explain where to find it and how its date windows and groupings work, but cannot expose the underlying internal ledger.
In-house media upload, transcription, and AI-analysis jobs share one global Cloud Tasks admission window. Due jobs are interleaved by workspace, collection run, and processing step; future retry times are respected, and concurrent drains cannot claim the same job. Ads remain visible immediately while this enrichment continues. Saved-ad jobs, landing-page screenshots, and other non-collection work keep their existing immediate dispatch paths. If the landing-page capture provider is temporarily unavailable, screenshot work stays queued with a delayed retry instead of being discarded.
Super Admin > Command Center > Unit Economics uses complete database-side aggregates instead of downloading capped raw ad and queue lists. Paid invoices are recognized across their Stripe service period, so an annual charge contributes its monthly share instead of appearing only in the payment month. Tracked provider costs replace only their matching fallback coverage; unrelated tracked and modeled dollars are never compared with a maximum or subtracted from one another. Historical ScrapeCreators cost is reported only for old ScrapeCreators production runs; current Brand Tracker collection is in-house. R2 rent accrues as estimated GB-months for time stored, while upload operations remain tracked separately. Ad Processor compute matches the deployed 1 vCPU, 2 GiB, request-concurrency-2 service and conservatively uses full instance seconds per job because actual overlap is not yet measured. The old fixed Ad Processor, Artifact Registry, and R2 placeholders are removed. Shared fixed costs are allocated across the full customer population before plan or user filters, and identical requests are coalesced for 60 seconds. The response explicitly reports a complete database aggregate with no 50,000-row raw-table cutoff. This platform-wide financial view is internal-only and intentionally excluded from the public REST API and MCP actions.
The Shared proxy pool supports DataImpulse as the primary provider and Decodo as backup. Routing is explicit on each proxy: Primary receives new work first; Backup is used when primary proxies are unavailable or cooling down. Existing jobs retain their leased session. Meta collection, landing-page desktop/mobile screenshots, and rendered web research share this pool. Tartol has no per-proxy session cap; Google Cloud worker admission controls concurrency. Each attempt uses one sticky residential session; retries can obtain a fresh session. Proxy transport failures delay the original operation and cool down that endpoint so the next attempt can use the backup. Saved checkpoints and completed captures are reused. Destination-specific page failures remain visible and do not prove that the entire proxy provider is unavailable. Proxy provider selection and routing are internal super-admin operations, intentionally excluded from public REST API and MCP actions. Tartol Agent explains this behavior from the Knowledge Base and cannot read credentials or change infrastructure settings. Expanded proxy rows show the selected provider endpoint, active sessions and the absence of a proxy session cap, and its compact usage summary. Aggregate traffic cards and the collection-run diagnostics panel are intentionally omitted from the configuration page. Facebook documents and GraphQL remain on the residential proxy. Allowlisted public Meta CDN assets bypass it and arrive as free Google Cloud ingress; direct CDN bypass bytes and requests remain available to internal monitoring. Tartol records observed proxy traffic and an estimate with a 25% transport safety margin for internal cost reporting only; those counters never pause or block collection. Once direct pagination owns a validated cursor, Tartol suppresses the duplicate native UI pagination XHR so each remaining page crosses the proxy once; unrelated XHR and beacon traffic is blocked after bootstrap. Eligible country and EU detail lookups reuse the same session as exact-ID GraphQL requests without loading creative media. The collector blocks full creative CDN transfers in the browser while retaining every normalized image, video, thumbnail, and carousel source URL. Video duration is decoded from signed URL metadata without fetching the video body. Original media supplied on Tartol's supported Meta CDN hosts therefore uses neither the residential proxy nor Google Cloud-to-R2 transfer: a private authenticated Cloudflare media-ingest Worker validates the signed URL and every redirect and streams the file directly into R2. Google Cloud receives only stored-object metadata and can read the archived object back from R2 for thumbnail, storyboard, or analysis work; R2 delivery has no egress fee and Google Cloud ingress is free. Small derivatives generated in Google Cloud can still be uploaded to R2 and use metered transfer; full creative bodies do not. A non-CDN or unsupported source remains on Tartol's existing SSRF-protected ingestion path.
Production in-house scans attempt every detail-eligible ad admitted in each browser segment, then checkpoint that segment's detail work before an intentional browser rotation. Detail coverage remains separate from list completeness: a runtime limit, Meta block, two consecutive detail failures, or a failed checkpoint can leave details incomplete without marking an otherwise proven ad list incomplete. Tartol stores only a bounded allowlist of Meta's public detail fields with exact ad-ID correlation and provenance; it does not retain detail request bodies, cookies, tokens, headers, or raw response bodies.
Exact per-ad detail, targeting-country, EU-transparency, media URL, and pagination compatibility is monitored with authorized real Meta probes through supported residential proxy endpoints, including DataImpulse and Decodo, across representative advertiser libraries. Authorization confirmation, proxy credentials, and low-level traffic telemetry are platform-wide internal controls and intentionally excluded from the public REST API and MCP actions. The control plane is writable only in production because local and staging previews share the production database. The Cloudflare admin API and Google Cloud collector must use the same canonical proxy-encryption key. Credentialed proxy endpoints use an explicit HTTPS/TLS proxy transport; missing or plaintext HTTP schemes are rejected before credential decryption, certificate verification stays enabled, and there is no HTTP fallback. Tartol Agent can explain the architecture, status, and troubleshooting steps and can direct a super admin to the configuration page. Tartol Agent cannot confirm collection authorization or change proxy credentials.
Understand Daily Activity
Daily Activity counts an ad as launched when Tartol first discovers it after tracking begins. It counts an ad as paused on the day a complete provider refresh no longer returns that ad as active. The pause date is therefore the day Tartol detected the change, which can be later than the moment the advertiser actually paused it.
Tartol retains each detected active-to-paused and paused-to-active transition so later media or analysis updates cannot move historical activity to another day. It also retains the last confirmed-active time as supporting evidence without presenting that time as an exact pause timestamp.
Complete tracked-brand refreshes repeat the same country, status, media, and sort filters with every POST cursor request. Facebook can collapse related ads into fewer collated cards than the displayed result count, so cursor exhaustion—not row-count equality—proves completion. An early lost cursor session can restart once. Persistent failures stop instead of creating a paid retry loop. Any capped, interrupted, or oversized rolling scan leaves missing ads active and never manufactures pause events.
Pause detection happens on the next successful complete refresh. While a library reports more than 2,500 active ads, its rolling refreshes continue finding and updating ads but pause detection is intentionally unavailable. If it later falls to 2,500 or fewer, a complete refresh can safely resume status reconciliation.